4.1 Retrofit Performance Gaps
Free Preview
Main contributors to Module 4
WARM Low Energy Building Practice for use of material from the CarbonLite CEPH course, Eric Parks, Andy Simmonds, Tim Martel (modelling), Paul Jennings (air tightness documents), Tina Holt (editing)
The key objectives of Module 4 are:
- to understand in more detail why energy performance gaps occur in many retrofitted (and new) buildings
- to consider ways to close the energy and comfort gaps in retrofits successfully
To do this,
- we will first look at evidence of performance gaps
- we will then look at the theoretical aspects of energy, power and heat transfer.
- this leads into energy in buildings: heat loss, heat load, annual consumption, degree days, heat loss and gain, heat loss areas and thermal performance factors
- embodied energy in retrofit is considered briefly
- we then go on to introduce 3 modelled examples of typical UK house types and how they might achieve different energy targets
- finally we show how the CarbonLite Certification process records the information covered in this Module.
Module 4 consists of the following lessons:
Lesson 4.1 – Retrofit Performance Gaps
Lesson 4.2 – Power and Energy in Buildings
Lesson 4.3 – Heat Load and Annual Energy Consumption
Lesson 4.4 – Useful, Delivered and Primary Energy
Lesson 4.5 – Energy Performance – Applying the Physics
Lesson 4.6 – The Five Factors of Thermal Performance – New Build
Lesson 4.7 – The Five Factors of Thermal Performance – in Retrofit
Lesson 4.8 – Introduction to 3 CLR Modelled House Types
Lesson 4.9 – The CLR Model – UK House Types
Lesson 4.10 – Form Factors, Heat Loss and Thermal Bridges
Lesson 4.11 – Embodied Energy in Retrofit
Lesson 4.12 – Module 4 homework
By the end of this lesson you will have learned about:
- The energy performance gap and examples
- Example of a retrofit which closes the performance gap
- The comfort gap
Lesson 4.1 – Retrofit Performance Gaps
We learned in Module 1 that gaps in building performance (energy use, comfort or moisture) can have negative impacts on occupants and the wider society.
Here we look in more detail at the extent of energy and comfort gaps, before moving on in the next few lessons to consider the relevant science and potential solutions.
1. The Energy Performance Gap
The difference between anticipated and actual performance is known as the performance gap. In low energy retrofit, this is the difference between the design stage energy performance target and the measured energy use post retrofit.
1.1 Introduction
Imagine a notional retrofit. It now has loft insulation, external wall insulation and new double glazed windows. A basic energy model would predict the improvement that these should make, but might not be able to predict the heat lost between these improved parts of the fabric. For example, additional (unpredicted) heat loss may occur:
- via cold bridging if the EWI does not meet the loft insulation or overlap the window frames
- via draughts if there are gaps around the edges of the newly installed windows
- via thermal bypass if air movement carries heat from the building (for example, when air in the loft space moves across mineral wool loft insulation and carries away the heat held within it)
The following documents on air leakage have been provided by Paul Jennings, Aldas:
- Air leakage sites in houses, image with link to key below:

Common Leakage Sites Diagram Key and Examples
For more thermal images showing air leakage examples, see Lesson 4.7
2. Guidance on minimising air leakage: Aldas 12 Steps to Airtightness – revised June 2019
3. Example of an airtightness testing report: Aldas P3727-03 Larch Corner Acceptance Airtightness Test Report for publication – April 2019
1.2 Examples of retrofits with an energy performance gap
Until recently there has been little hard information available about the performance of home energy retrofit – despite the existence of various publicly-funded programmes. However, when monitoring has been done, it often shows that the retrofitted homes fail to make the savings predicted by SAP and RdSAP.
Note:
The Standard Assessment Procedure (SAP) is the methodology used by the Government to assess and compare the energy and environmental performance of dwellings (to inform government policy).
Reduced Data SAP (RdSAP) was introduced in 2005 as a lower cost method of assessing the energy performance of existing dwellings.
Example 1 – 1930’s house
Technical performance tests (by co-heating) on the energy retrofit of one 1930s house found that a standard retrofit delivered only 73% of the predicted energy saving.1 Thermal imaging revealed a number of gaps had been left in the insulation – around the eaves for example.
What is co-heating? (taken from http://eprints.leedsbeckett.ac.uk/id/eprint/4327/8/BRI%20-%20Bridging%20the%20fabric%20performance%20gap%20%2017%20Oct%2014%20submitted.pdf)
A coheating test is a method of measuring the heat loss (both fabric and background ventilation) in W/K attributable to an unoccupied dwelling. It involves heating the inside of a dwelling electrically, using electric resistance point heaters, to an elevated mean internal temperature (typically 25 °C) over a specified period of time, typically between 1 to 3 weeks. By measuring the amount of electrical energy that is required to maintain the elevated mean internal temperature each day, the daily heat input (in Watts) to the dwelling can be determined. The heat loss coefficient for the dwelling can then be calculated by plotting the daily heat input against the daily difference in temperature between the inside and outside of the dwelling (ΔT). The resulting slope of the plot gives the heat loss coefficient in W/K.
In order to obtain a sufficient value of ΔT (generally 10 K or more), the coheating test should be carried out in the winter months, usually between October/November and March/April.
The above retrofit had been done under careful supervision as it was part of an academic research study (see Footnote 1 above). Other retrofits have suffered similar difficulties, including some of the examples given below.
Example 2 – mass retrofit
The technical performance of mass retrofit programmes have not generally been scrutinised. However, in several EWI programmes carried out under government schemes, the following have been observed:
- insulation can be seen to stop short of the ground
- insulation goes up to the eaves, but may stop short, and in any case there is usually a gap between the wall insulation and the loft insulation
- window reveals are in some cases left uninsulated as well²
- other gaps within the external wall insulation can occur, especially around items attached to the walls (gas meter boxes, drain pipes, lamp posts etc)
These performance gaps are sometimes a build issue, and sometimes a design issue. See the image below of a wall – roof junction for a house where the cavity wall cannot be insulated.
- On the left, the house has a thin layer of loft insulation but no other insulation measures.
- On the right, the same house has been retrofitted with extra loft insulation and internal wall insulation. A triangular piece of insulation has also been added internally where the wall and ceiling meet to reduce the thermal bridge at this junction.

Footnote 2: EXTERNAL WALL INSULATION IN TRADITIONAL BUILDINGS: Case studies of three large-scale projects in the North of England by NDM Heath Ltd published by English Heritage (e.g. section 2.1.3 on thermal bridging)
https://historicengland.org.uk/images-books/publications/external-wall-insulation-traditional-buildings/ : external-wall-insulation-in-traditional-buildings
Leaving gaps in the insulation dramatically diminishes the thermal performance. Heat loss through such gaps (or ‘cold bridges’) may account for around a third of the heat loss from the entire building. Good detailing and careful installation however will reduce or eliminate this shortfall.
Thus, much retrofit is probably failing to achieve its full – once in a lifetime – potential to improve the fabric of the treated homes. And monitoring of retrofitted buildings in use shows wider discrepancies again.
Example 3 – social housing
Some studies – such as one carried out by Gentoo housing in the north east of England – have shown that householders are only saving half as much energy as was predicted (we have been unable to obtain a link to any of these studies so far).
The discrepancy between predicted and actual energy savings is commonly a combination of construction performance gaps and comfort take by residents who previously found it hard to heat their homes. The latter effect is documented in another Gentoo study ³ where health benefits have been recognised.
Example 4 – co-heating test on multiple properties
In order to determine actual heat loss from the building fabric, the projects in the graph below were subjected to co-heating tests.
It can be seen that there is a difference between the theoretical design and the as-built performance (i.e. all the buildings lose more heat under the test conditions than predicted)
The performance gap for the 2 Passivhaus dwellings on the right actually falls within measurement error. In effect they are the first homes Leeds Beckett University have found that have closed the fabric performance gap.
Click on the image to see at full size:

“In essence it is the Quality Assurance (QA) process that is the key to closing the performance gap.”
Mark Siddall
The process of formal certification of buildings e.g. Passivhaus certification, AECB CarbonLite certification as well as the experience and integrity of the certifier (or self-certifier) are also factors that influence the final extent of any performance gap.
2. Example of a retrofit which closes the performance gap

In the first UK retrofit to be certified to the EnerPHit Standard, the consumption of mains natural gas used for space and water heating and cooking in the house was recorded after completion along with internal and external temperatures and relative humidity. No electricity or biomass fuel is used for ‘top up’ heating in the house.
Table of recorded internal temperatures at Grove Cottage

Measured and forecast monthly gas consumption 2010 compared to ‘a typical similar house’

In the graph above, to compare the predicted (grey bars) with the measured (white bars) performance, the project’s PHPP file was used to produce the predicted consumption for 2010. To look at the accuracy of the PHPP project file, the house internal temperature was adjusted to that actually measured (21°C) and in addition the monthly mean external temperatures were also changed using the UK Met Office official 2010 figures for the Midland region. The PHPP generated predicted gas consumption can be seen to be fairly close to the measured consumption for this project.
The black bars show the predicted consumption for a similar, typical unimproved UK house heated to 21°C using NHER Evaluator software. Comparing the EnerPHit refurbishment with a typical similar house, both at 21°C gives a saving on gas consumption of 28,000 kWh/yr or £880/yr. However for a typical house an internal mean temperature of 21°C is unlikely to be afforded, so the savings are better expressed relative to a typical house at a mean internal temperature of 17°C i.e. 17,000 kWh/yr or £535.
Example above taken with permission. See Suggested Reading.¹
IPH_Conference_2012_How_can_EnerPHit_inform_the_UK_Green_Deal-2
Courtesy of Simmonds.Mills Architects.
3. The comfort gap
If there is an energy gap, there is likely to be a comfort gap.
3.1 Feeling the cold
SAP sets a fixed living temperature (21°C in the living area and 18°C everywhere else) – it has to, for its primary purpose of comparing the energy performance of different buildings independently of whoever occupies them. But as we have seen, many people cannot afford to keep their homes this warm.4
(Footnote 4: you_just_have_to_get_by “Coping with low incomes and cold homes. by CSE and University of Bristol)
Government commissioned modelling suggests the mean indoor temperature in UK dwellings is around 17°C; further analysis of the data by the AECB suggests it may even be lower than this.
Yet when people live in a well-insulated home that is cheap and easy to heat, they usually keep it considerably warmer – from around 19°C up to 22°C or even higher.5 Clearly most people find 17°C a bit cool compared to what they would like. It may also be unhealthy, as we have seen above.
Footnote 5: Retrofit Revealed, Innovate UK
In the Gentoo study referred to previously (footnote 3), it turned out that prior to the upgrades the householders had been using 40% less energy than RdSAP calculations had suggested. For such households, potential savings from any upgrade will be proportionally lower than the predictions. If occupants take advantage of an upgrade to be more warm and comfortable, the savings will be less – and might be eaten up altogether.
Even when occupants are better off financially, it can be physically impossible to consistently keep an unimproved home at 18-21°C; the heating system may not be powerful enough to overcome the effect of low-performance building elements and cold draughts. Once again, when their homes are retrofitted, the occupants tend to keep the internal temperatures warmer than they were before, and once again, this means energy savings will be less than predicted by the standard modelling.
3.2 “Energy take-back” and “rebound”
When occupants choose to enjoy their retrofitted house by living with higher temperatures post retrofit, this is called “energy take-back” or “rebound”, and the predicted energy savings of the retrofit are of course diminished. This increase of living temperature is, at times, viewed rather impatiently by designers and strategists – they lead to “underachievement in real-world energy savings” as one DECC document put it.7
The CarbonLite Retrofit Programme takes a rather different perspective on this. The Programme sees warm homes and comfortable occupants as a success – indeed, one of the main objectives of any home retrofit. But achieving a warm and comfortable home should not be instead of energy savings – occupants should get both.
Thus AECB believes homes should be comfortable and healthy – a good environment for the occupants, as well as good for the wider environment. CLR in its thermal and financial modelling has therefore set an assumed internal ‘whole house’ temperature after retrofit of 20°C, representing the average temperature of all habitable rooms in the house.
3.3 All-round comfort
As we discussed in Module 1, a poorly retrofitted home may not be as comfortable or as healthy as it could be. There is more to comfort – and to a healthy living environment – than indoor air temperature alone.
Relative humidity, air movement and surface temperatures are important. Rapid changes in temperature, cold draughts, and cold surfaces (particularly windows) can all make occupants less comfortable.
The CarbonLite Retrofit whole-house approach aims to combat these causes of discomfort, as well as saving energy:
- No draughts from outside – because airtightness is improved to around 3.0 – 1.5 ach @50Pa (or 1.0 and 0.6 for EnerPHit & Passivhaus Standards respectively) and ventilation is properly designed and controlled
- Downdrafts created by room air chilled by poor glazing are reduced in medium retrofits (higher quality double glazing + radiators below glazing) and eradicated for deep retrofits (i.e. those with triple glazing). Little or no condensation occurs on the inside surface of windowpanes even in very cold weather (Note: triple glazing may have condensation on the outside because so little heat passes through the glazing.)
- Even if the indoor air temperature is kept the same as before the retrofit, the building will feel warmer because of increased radiant temperature of surfaces (better fabric insulation) no draughts and if MVHR is used, more consistent ventilation air temperature.
Along with adequate ventilation, ensuring all internal surfaces reach a reasonable minimum temperature it is important to minimise the risk of condensation, and subsequently, mould growth. As well as being inconvenient and unattractive, mould can harm physical health. Removing this harm is an important aim of retrofit.
4. Further optional information:
Are homes even colder with lower performance than currently imagined?
This is a confused issue partly due to the lack of clear measured data fully describing space heat consumption and measured surveys of actual achieved whole house temperatures typical across the UK.
Our understanding of these issues is based on resources such as the ECUK domestic data tables 2013: https://www.gov.uk/government/collections/energy-consumption-in-the-uk
The mean annual gas (or electricity) consumption presented in these data tables and attributed to, a particular dwelling type, or age, occupancy or floor area etc. is the government issued result of the following calculation:
- Utility Companies provide the measured aggregate gas and electricity consumption for domestic customers (via meter readings). The aggregate figures are not broken down in any more detail. These consumption figures relate to delivered energy not space heat demand – the difference being that delivered energy includes the extra consumption related to the (in)efficiency of the boiler and is therefore slightly higher than the space heat demand.
- These delivered energy figures are then divided by the number of households across the whole of the UK, including empty/second homes i.e. includes some dwellings using as little as 100kWh/yr as well as dwellings using up to 50,000kWh/yr. So the final published resulting annual ‘per household’ consumption figure may underestimate the average consumption of fully occupied homes
- The average per-household figure is then divided by various numbers (no. of bungalows, floor area, occupancy, average salary etc.) to present total annual consumptions in the range of categories chosen in the ECUK tables
- Currently we are focusing on space heat modelling for the AECB retrofit programme work – and to make things simpler in CLR modelling/course writing process we have concentrated on using publicly available data related to homes heated using natural gas.
Based on the above reasoning our interim conclusions are:
- That due to empty homes/second homes using very little heating (e.g. frost protection) then ‘typical dwellings’ would be likely to use more gas in both the lower and upper ranges to achieve average winter internal whole house actual temperatures of 17°C
- That the use of electricity for secondary/backup/supplementary space heating is not identified in the ECUK tables – so more energy may be being used for space heating than represented in the ECUK data in order to make up for the colder (less than 17°C) temperatures experienced in reality e.g. even in gas centrally heated homes electric heaters may be used to counter ‘cold draughts’
- Because the quoted ‘national average internal temperature’ of 17°C is modelled rather than measured through surveys, that homes are probably achieving a lower average whole house temperature than the 17.2°C normally quoted.
This suggests an even colder and less well performing building stock than currently imagined with homes being more likely to be colder and more energy hungry than the official figures indicate.
We recognise that it is difficult to reach a definitive understanding of the difference between measured data and modelled data. However this is important as it potentially significantly changes the cost effectiveness of retrofit. This is looked at again in Section 8, where we suggest that a deep-retrofitted house could achieve an average winter temperature of 17°C without supplementary heating (i.e. an actual or measurable 17°C average).
Summary
In this Lesson we have looked in more detail at the energy and comfort performance gaps, why they occur and how common they may be.
There are no quiz questions for this lesson. Go straight to Lesson 4.2
Footnotes
- https://www.leedsbeckett.ac.uk/-/media/files/research/leeds-sustainability-institute/temple-avenue-project/lsi_tap_part2.pdf
- EXTERNAL WALL INSULATION IN TRADITIONAL BUILDINGS: Case studies of three large-scale projects in the North of England by NDM Heath Ltd published by English Heritage https://historicengland.org.uk/research/results/reports/6941/ExternalWallInsulationinTraditionalBuildings
- https://democracy.gedling.gov.uk/documents/s6421/Warm%20Homes%20on%20Prescription%20Pilot%20-%20Revised%20Private%20Sector%20Housing%20Grants%20and%20Assistance%20Policy%202015.pdf
- https://www.bristol.ac.uk/media-library/sites/geography/migrated/documents/pfrc1006.pdf “Coping with low incomes and cold homes. by CSE and University of Bristol
- Retrofit Revealed, Innovate UK: https://www.ukgbc.org/wp-content/uploads/2018/10/Retrofit-Revealed-The-Retrofit-for-the-Future-projects-data-analysis-report.pdf
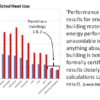
- In the worst cases it has been known for occupants to find that after a shallow retrofit they are actually using more energy than before. Research by Jenny Love at Salford University demonstrates that the deeper the retrofit, the less likely this is to happen. Her work involved a modelling a range of retrofit options and a range of ‘energy use behaviour’ options. Her findings showed evidence that: “It is much easier for behaviour change to cause increased energy use if only moderate energy efficient retrofit is undertaken..[However] …if significant improvements in heat loss and system efficiency are undertaken, space heating energy use will reduce irrespective of occupant behaviour”
(Love, J. Mapping the Impact of Changes in Occupant Heating Behaviour on Space Heating Energy Use as a Result of UK Domestic Retrofit. Retrofit Conference, University of Salford, UK, 2012) This publication is no longer available, however the same author has continued their research in this following thesis: Understanding the interaction between occupants, heating systems and building fabric in the context of energy efficient building fabric retrofit in social housing (Love, J. UCL, 2014) - DECC June 2012 Green Deal Impact Assessment, https://researchbriefings.files.parliament.uk/documents/SN05763/SN05763.pdf